Superset Dashboard Configuration
Introduction
During N2ACD Reporting Processing Node installation, Apache Superset is installed. This includes the base initialisation steps required to access Superset via GUI.
Accessing N2ACD reporting data using Superset requires the following general high-level steps:
- Configure
n2reportingdatabase access. - Expose information from the databaes to superset via
datasets. - Configure
chartsto display information visually. - Collect information together into a
dashboard, to display a group ofchartsor other ad-hoc information for combined display.
Superset Configuration
Superset provides comprehensive documentation on importing data and creating dashboards, which is documented on its official site.
This section will cover some basic configuration from the perspective of N2ACD as a starting point.
Database
Superset requires a connection to the reporting database.
- Navigate to
Data>Databases - Click on
+ DATABASEto create a new database connection to the reporting database:
| Parameter | Value |
|---|---|
| Type | PostgreSQL |
| Host | Reporting Database Host/IP |
| Port | Reporting Database Port |
| Database Name | n2reporting |
| Username | n2reporting_reader |
| Password | n2reporting_reader account password |
| Display Name | Reporting Database |
Dataset
For each piece of information to query or chart, a dataset is required.
- Navigate to
Data>Datasets - Click on
+ DATASETto create a new dataset:
| Parameter | Value |
|---|---|
| Database | Reporting Database |
| Schema | n2acd |
| Table | As per Reporting Data Model |
Chart
Charts are used to visualize data made available via a dataset.
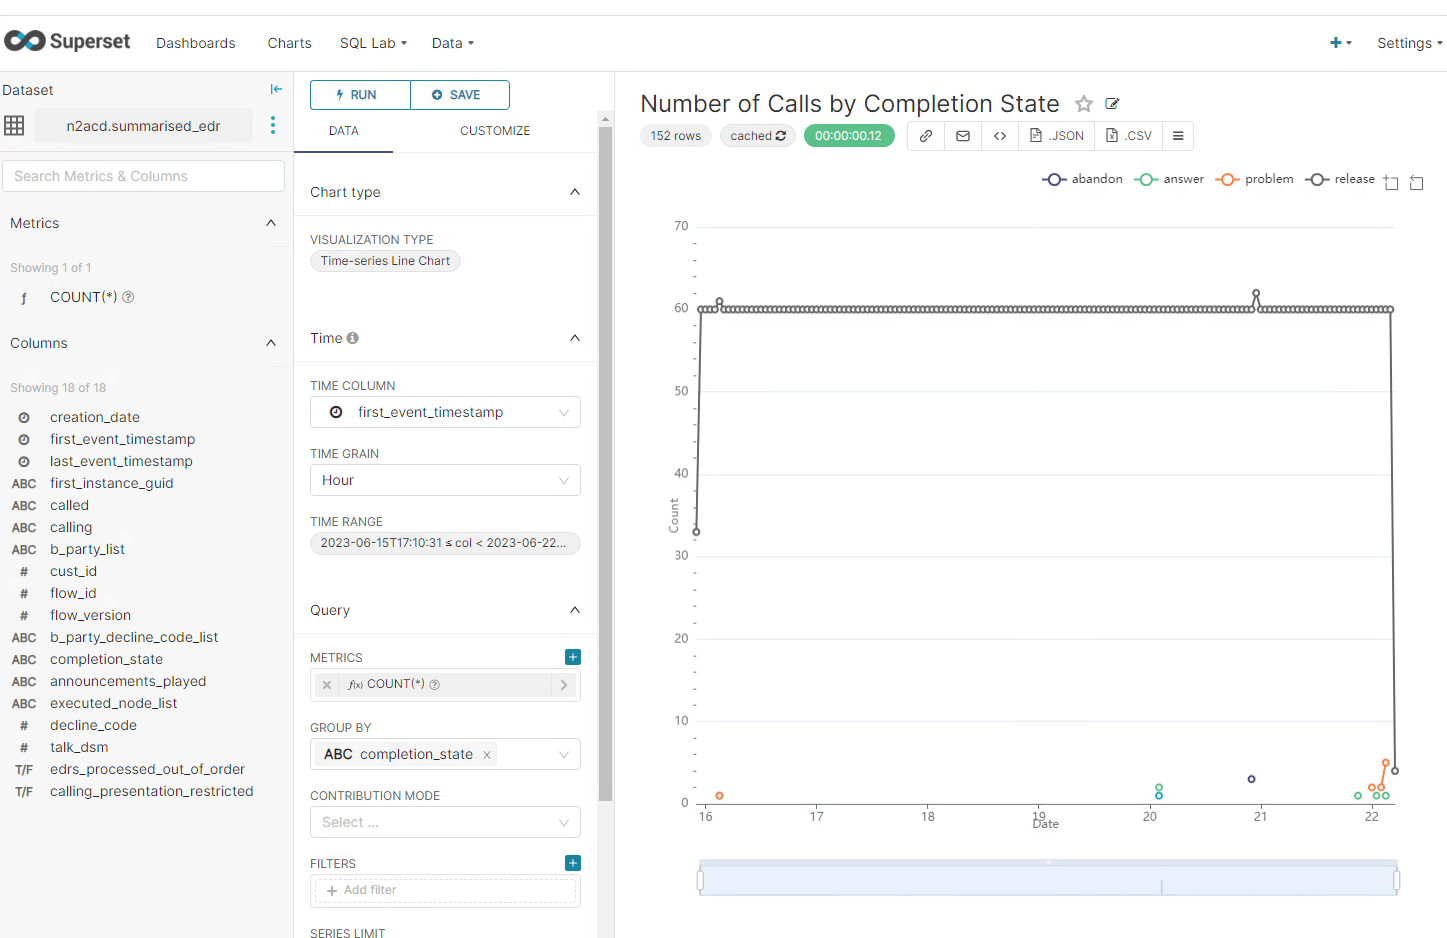
An example chart graphing calls to the ACD platform by their completion state for the last 7 days would be configured as follows:
- Navigate to
Charts - Click on
+ CHARTto begin the chart creation process. - Select
n2acd.gather_summarised_edrfor the dataset. - Select
Time-series Line Chartfor the visualisation. - Configure main fields/parameters as follows:
| Parameter | Value |
|---|---|
| Time Column | first_event_timestamp |
| Time Grain | Hour |
| Time Range | Custom Relative Date: Time 7 Days Before Now |
| Metrics | COUNT(*) |
| Group By | completion_state |
- Configure customized fields/parameters as follows:
| Parameter | Value |
|---|---|
| X Axis Title | Date |
| Y Axis Title | Count |
| Marker | Checked |
| Data Zoom | Checked |
| Show Legend | Checked |
- Save as
Number of Calls by Completion State
The result will be a graphed view of call completion e.g.:
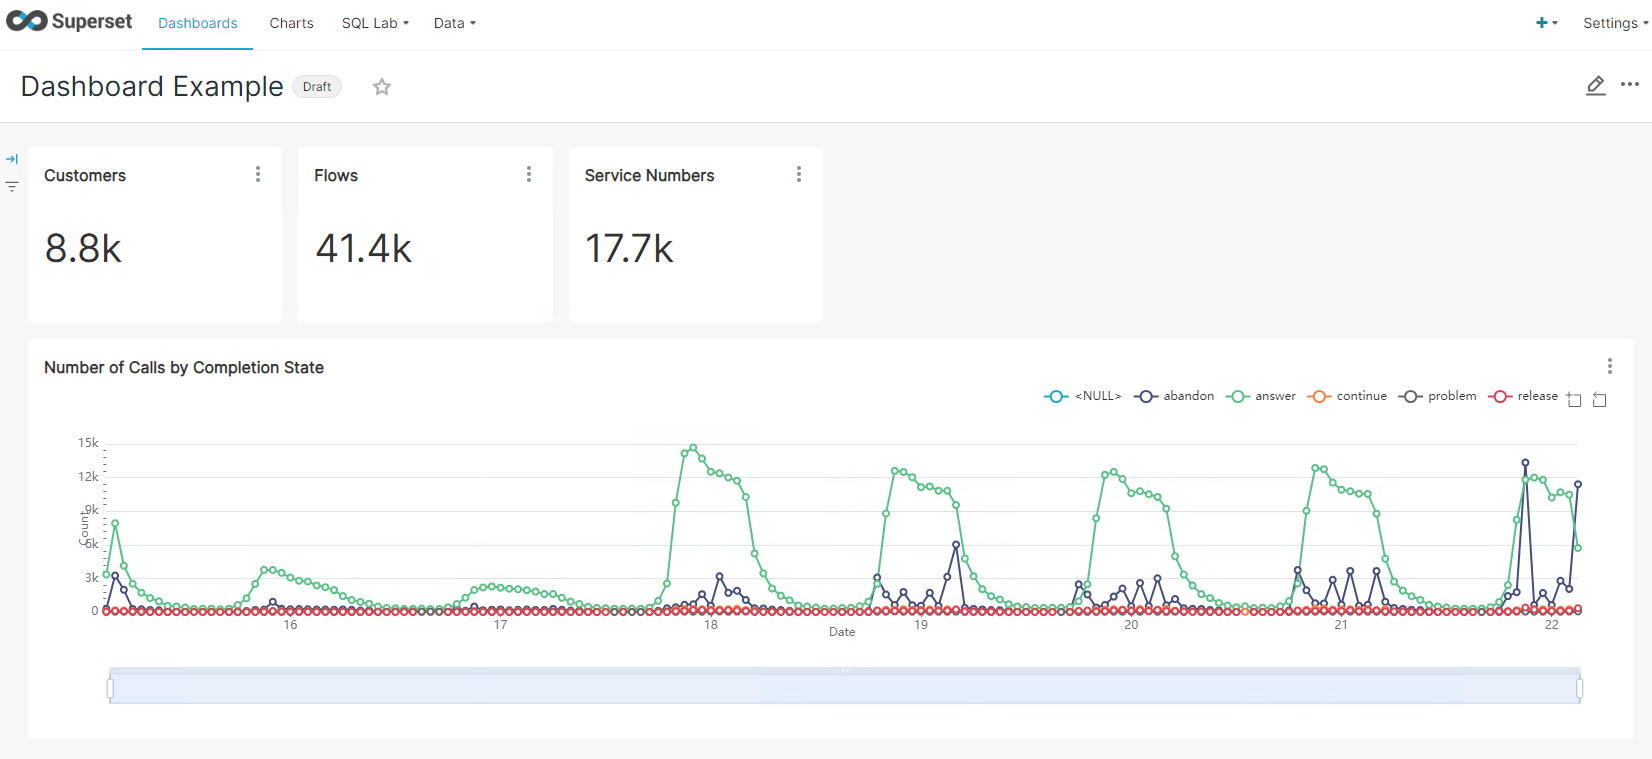
Dashboard
Dashboard configuration involves dragging information, such as a chart, onto a canvas and sizing as appropriate for information display.
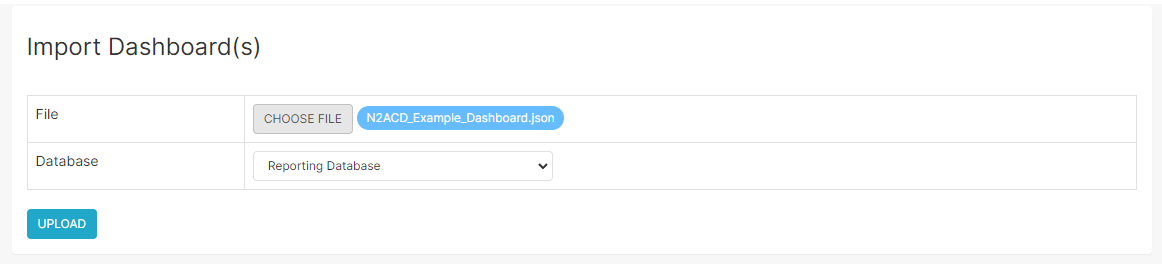
An example dashboard import file is installed with the N2ACD REP package and can be found in the /usr/share/n2acd/etc/superset directory on the reporting server.
| File | Description |
|---|---|
| N2ACD_Example_Dashboard.json | Example Dashboard with various example pieces of ACD information. |
This can be imported via the Settings > Import Dashboards page:
The dashboard import process contains the following charts and datasets that must not exist prior to the import (or it will fail):
Charts:
- Customers
- Flows
- Number of Calls by Completion State
- Service Numbers
Datasets:
- gather_summarised_edr
- latest_customer
- latest_flow
- latest_service